

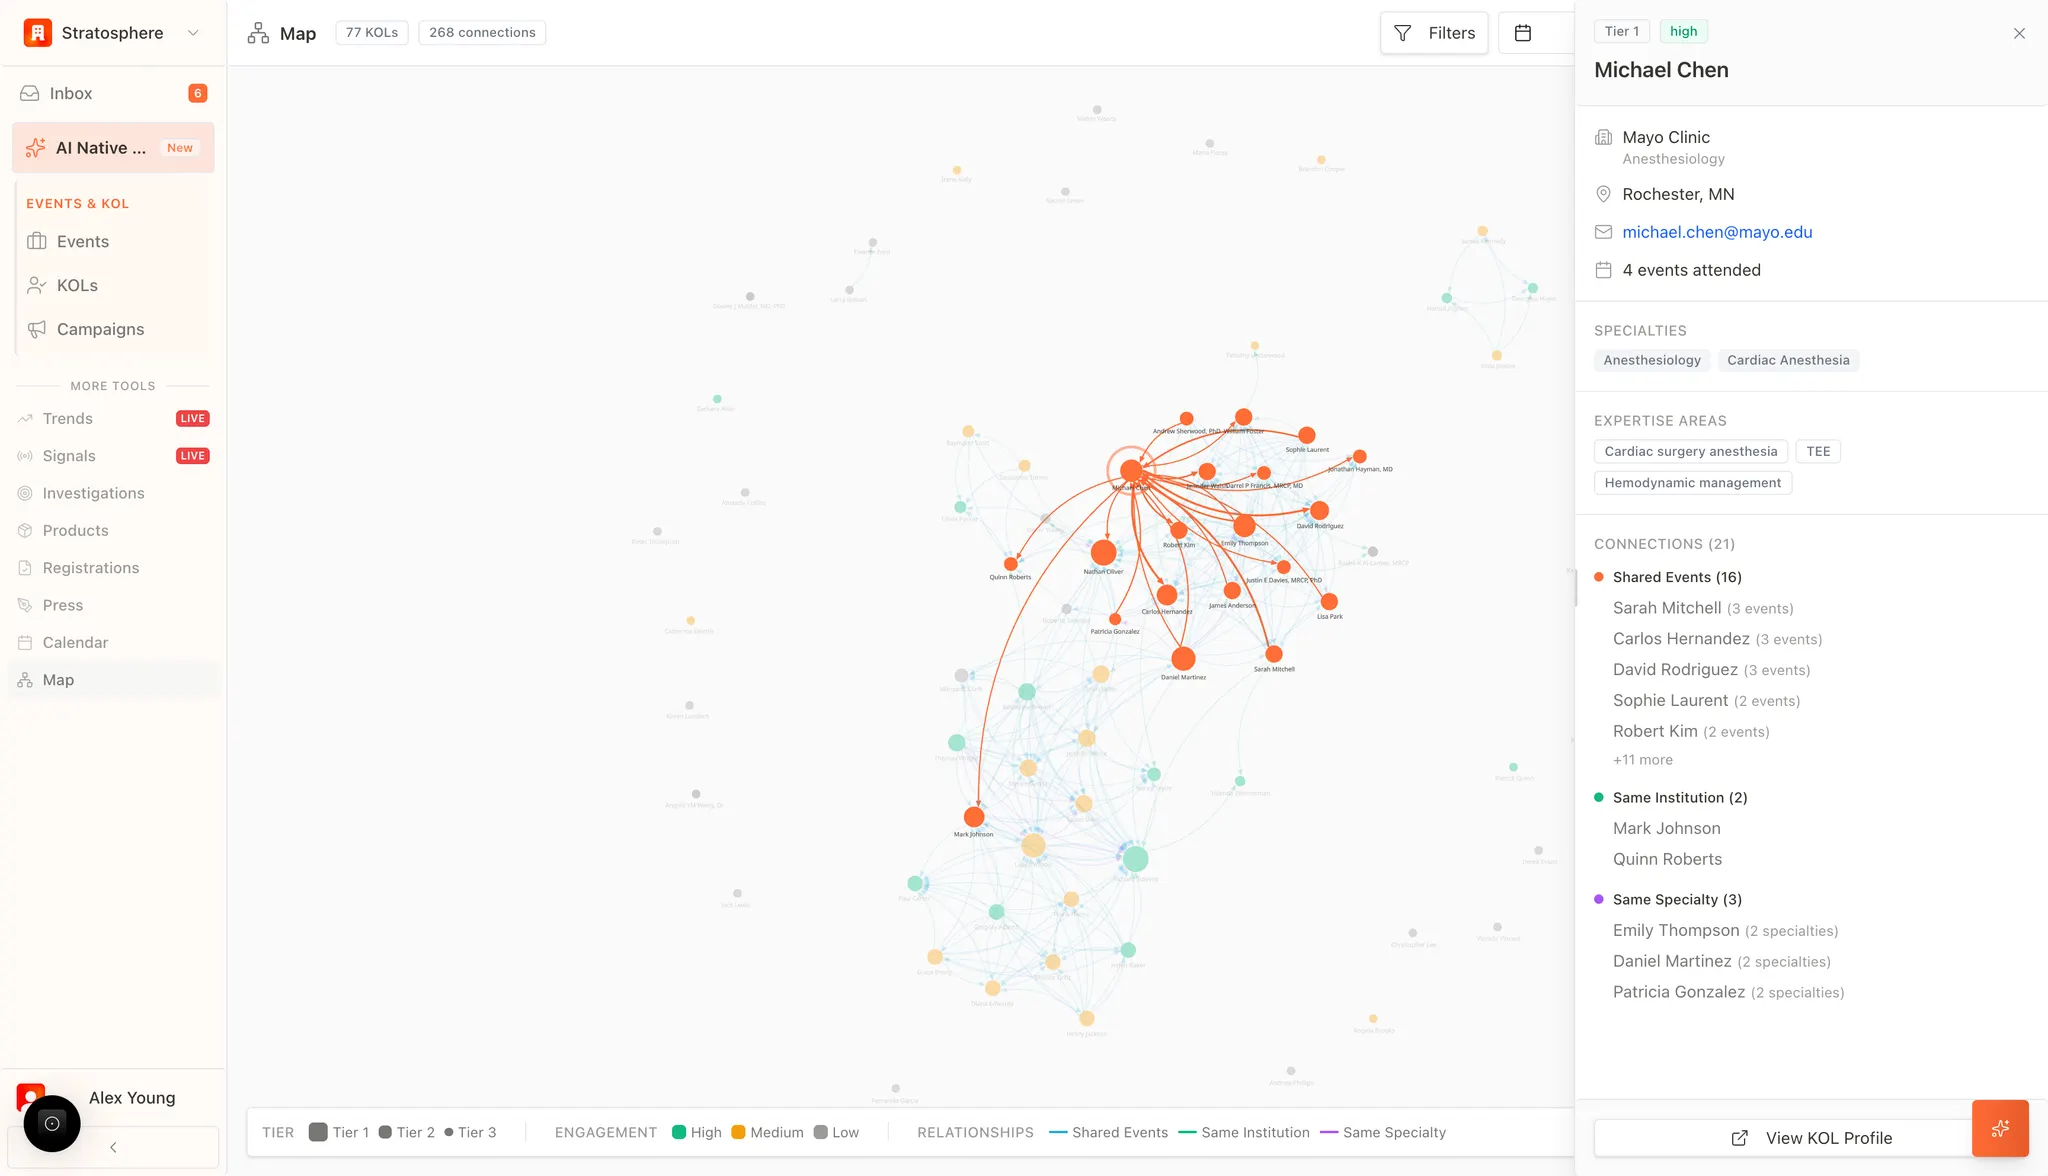
What you can do
- See how KOLs connect via shared events, institutions, and specialties.
- Find clusters (communities) and bridge nodes (connectors).
- Filter the network to focus on a segment (tier, engagement, event, specialty).
Where to find it
- Open
Mapfrom the main navigation.
How relationships are defined
The map draws connections using color-coded relationship lines:- Shared events (blue): KOLs who attended the same events.
- Same institution (green): KOLs affiliated with the same organization.
- Same specialty (purple): KOLs sharing the same clinical/research focus.
Understand nodes and scale
Each node on the map represents an individual KOL, with visual properties reflecting their strategic standing:- Engagement Level: Nodes are color-coded by the degree of organizational interaction: High (Green), Medium (Orange), or Low (Grey).
- Tier Classification: The size and shading of the nodes correspond to the assigned tier (Tier 1, Tier 2, or Tier 3), allowing for the immediate identification of the most critical influencers in the network.
- Network Statistics: The top summary bar tracks the total volume of the network, currently monitoring 77 KOLs and 268 unique connections.
Filters and layouts
To navigate complex networks, the interface includes professional visualization tools:- Event Filtering: Isolate relationships formed through specific events or time periods via the All Events dropdown.
- Visualization Modes: Toggle between different layout algorithms, such as Force Directed, to optimize the clarity of dense clusters or identify isolated experts on the periphery.
- Advanced Filters: Refine the view based on tier, engagement level, or specialty to focus on specific strategic subsets.